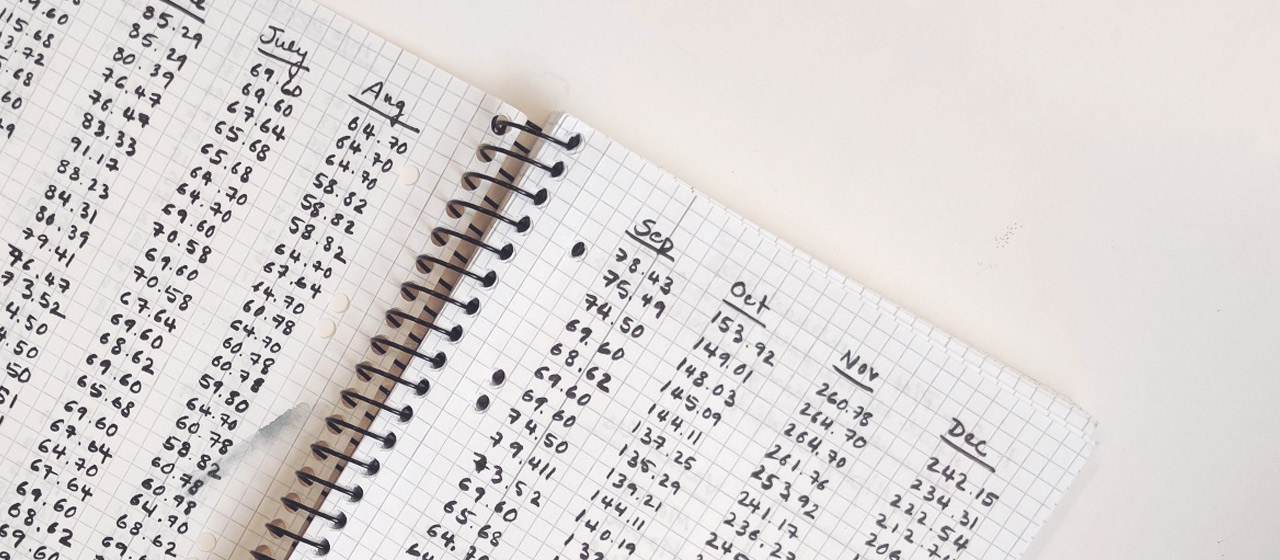
Data
During Diwali, when almost every household across India bursts fireworks simultaneously, environmental problems arise.
Research
Delhi, India’s capital, has been consistently named as one of the most polluted cities worldwide. In 2016, post Diwali, due to terrible air quality, the government declared a public health emergency and shut down schools as well as power plants around Delhi temporarily.
This particular study, published in 2018, is one of the first causal estimates of the contribution of Diwali fireworks to air pollution. Using hourly data on PM 2.5 particulate concentration from 2013 to 2017, the Diwali effect on air quality in Delhi is estimated.
Read the Study Link to data set
Data Visualisation
The data is multivariate: it consists of data separated month-wise, and each month consists of a PM2.5 level associated with every hour of the day. Additionally, the data is time-related and cyclical in nature.
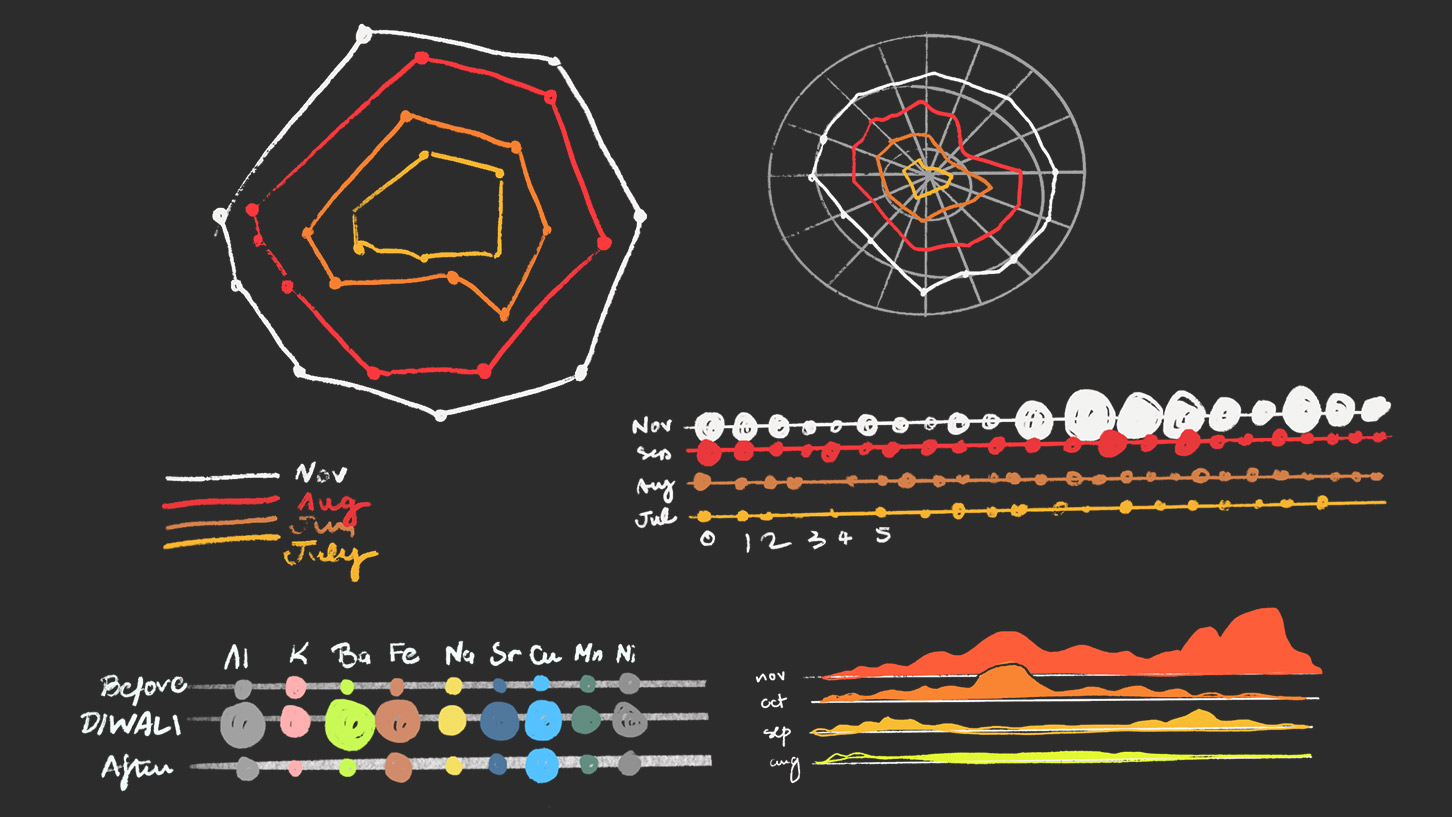
Experimentations were done with different formats and graphs, but it was difficult to perceive exact values due to the multi-dimensionality of the data set.
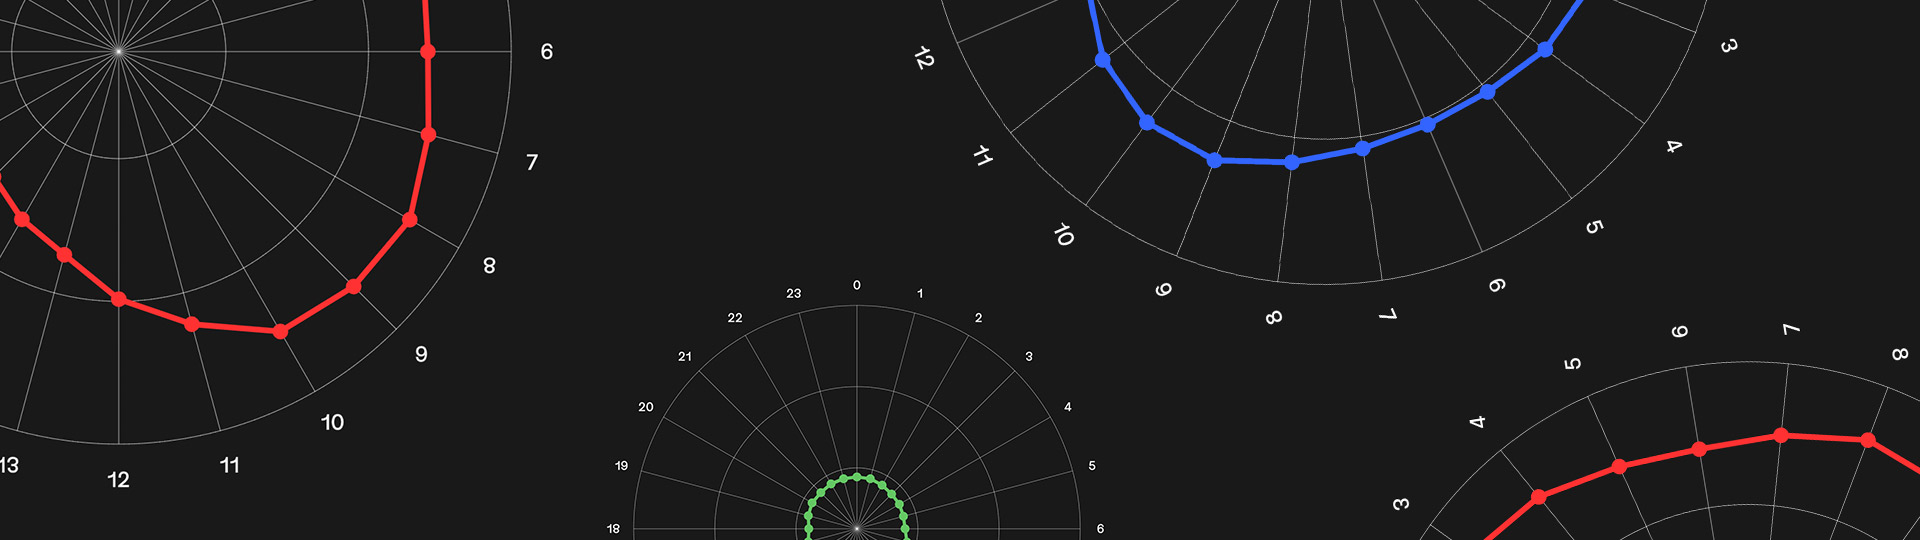
Why Polar Charts?
Considering the nature of the dataset, using a polar chart was most apt, since they best visualize time-related cyclical data! Furthermore, due to the presense of radial guides, exact values can be determined.
(Also, as an added bonus, they do kind of look like fireworks.)
Data Viz Interactive Sketch
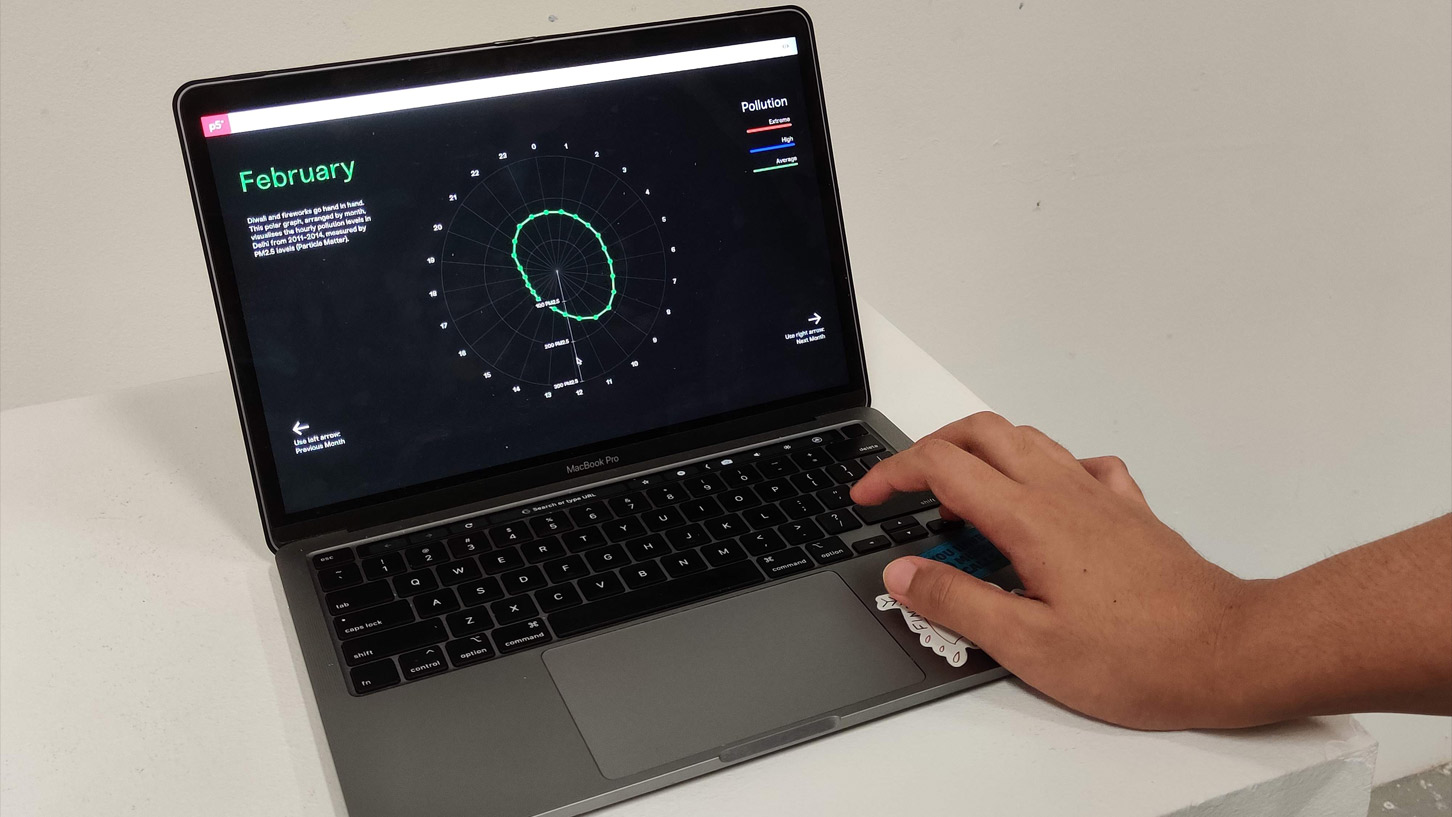
Characteristics
1. In order to maintain legibility, which is the main priority when it comes to data visualization, each month was separated into a different graph and can be viewed by perusing through the p5.js sketch using arrow keys.
2. A moving jig that follows the mouse is present as well, and aids in determining values.
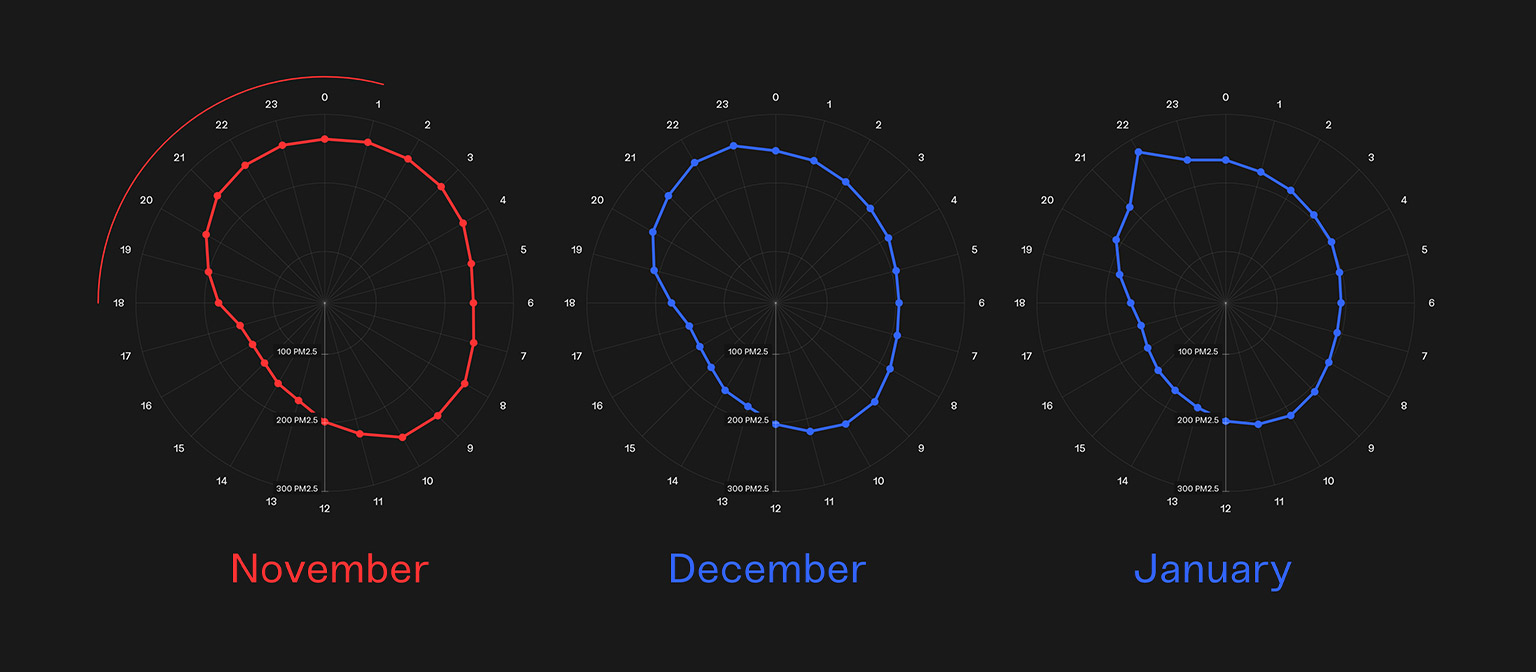
3. The larger the polar shape, the more polluted that month is, and line colours are ascribed to further distinguish between months with average pollution or months with more pollution.
4. In the month of November, an indication is made as to when Diwali fireworks burst (6PM-1AM roughly).
Findings
There is a drastic increase in pollution between October and November, which was expected, and can be clearly seen in the graph, with a notable increase during nighttime (which is when fireworks are burst).
However, after the data visualisation, December and January were quite polluted as well. There is also a sharp decrease in PM 2.5 levels between January and February.
On further research, I realised that this was also due to the presence of winter: particles remain suspended in the air for a longer duration of time due to the lower temperature, wind speed as well as higher relative humidity.
However, since November is still the most polluted month despite December and January actually being much colder, the causality of Diwali is not removed. Diwali pollution is exacerbated by the cold winter months.
Insights
From the graph, it can be understood that Diwali is not the main contributor to winter pollution but instead is significantly exacerbated by it. Therefore, the data visualisation allowed me to understand that while Diwali fireworks are a problem, it is not a one-dimensional problem and several other factors have to be considered as well.
By building the data visualization, I understood how to format this kind of data, keeping in mind its multivariate nature, and how to prioritise legibility over aesthetics. I did struggle with the different months and the differences in scale but when I separated each month into its own graph, that worked.
Conclusion
From what we have seen before, Diwali is still a notable contributor to pollution, especially in the month of November. Recently, governments around India have passed legislation to ban fireworks, but by removing them entirely, then a joyous custom and spectacle associated with Diwali is also lost. How can we move forward, and what solutions could we possibly think of? How can we integrate ‘light’ into the equation?
For a more solution based approach, check out the Artefact.
Artefact
References
- Ghei, Dhananjay, and Renuka Sane. “Estimates of Air Pollution in Delhi from the Burning of Firecrackers during the Festival of Diwali.” PLOS ONE, vol. 13, no. 8, 2018,
- https://doi.org/10.1371/journal.pone.020037